 pooml /ˈpuːml/ · the Poor Man's Logger
SELECT * FROM logs;
That's the query language. pooml is a logs + metrics server in one small binary: SQLite inside, SQL outside, a web UI on top. Ship logs from FluentBit, push metrics over OTLP or scrape Prometheus endpoints, draw dashboards, get alerts on your phone.
No new query language. That's the feature.
Every observability tool ships its own query dialect: LogQL, PromQL, KQL, SPL, three flavors of Lucene. Each one you learn just well enough to forget by the next incident.
pooml's query language shipped in 1974 and you already know it. Logs and metrics live in SQLite tables; you query them with SELECT, WHERE, GROUP BY, and friends. Full-text search rides on FTS5. A query builder exists for the lazy mornings, and it compiles to SQL you can read, edit, and keep.
-- errors across every service, last hour
SELECT * FROM logs
WHERE level >= 4 AND timestamp > unixepoch('now', '-1 hour') * 1000
ORDER BY timestamp DESC
-- which service is the noisiest?
SELECT service, COUNT(*) AS lines
FROM logs GROUP BY service ORDER BY lines DESC
-- p50-ish checkout latency, by hour
SELECT timestamp / 3600000 * 3600000 AS hour, AVG(value)
FROM metrics WHERE name = 'checkout_latency_seconds'
GROUP BY hour ORDER BY hour
Your AI assistant already speaks pooml
Because the query language is SQL, there's no custom DSL for an LLM to hallucinate around. @pooml/mcpconnects Claude - or any MCP client - to your instance: strictly read-only, through the same SQL validation as the UI, credentials never leaving your machine. Ask "what broke last night?"and the model writes the query.
Off by default: enable the query API on your pooml server first (POOML_QUERY_API_ENABLED=true plus its own POOML_QUERY_API_AUTH_SECRET), then on your machine:
claude mcp add pooml -e POOML_URL=https://your-pooml-host:8080 -e POOML_QUERY_API_AUTH_SECRET=your-query-secret -- npx -y @pooml/mcpWhat's in the binary
Logs
FluentBit-compatible ingestion, per-line format detection (JSON, CLF, plain), full-text search, live tail, infinite scroll.
Metrics
OTLP/HTTP push and Prometheus scraping. Counters and gauges only, on purpose - histograms are downcast to their _sum/_count series. Query builder, charts with gap-aware series.
Dashboards
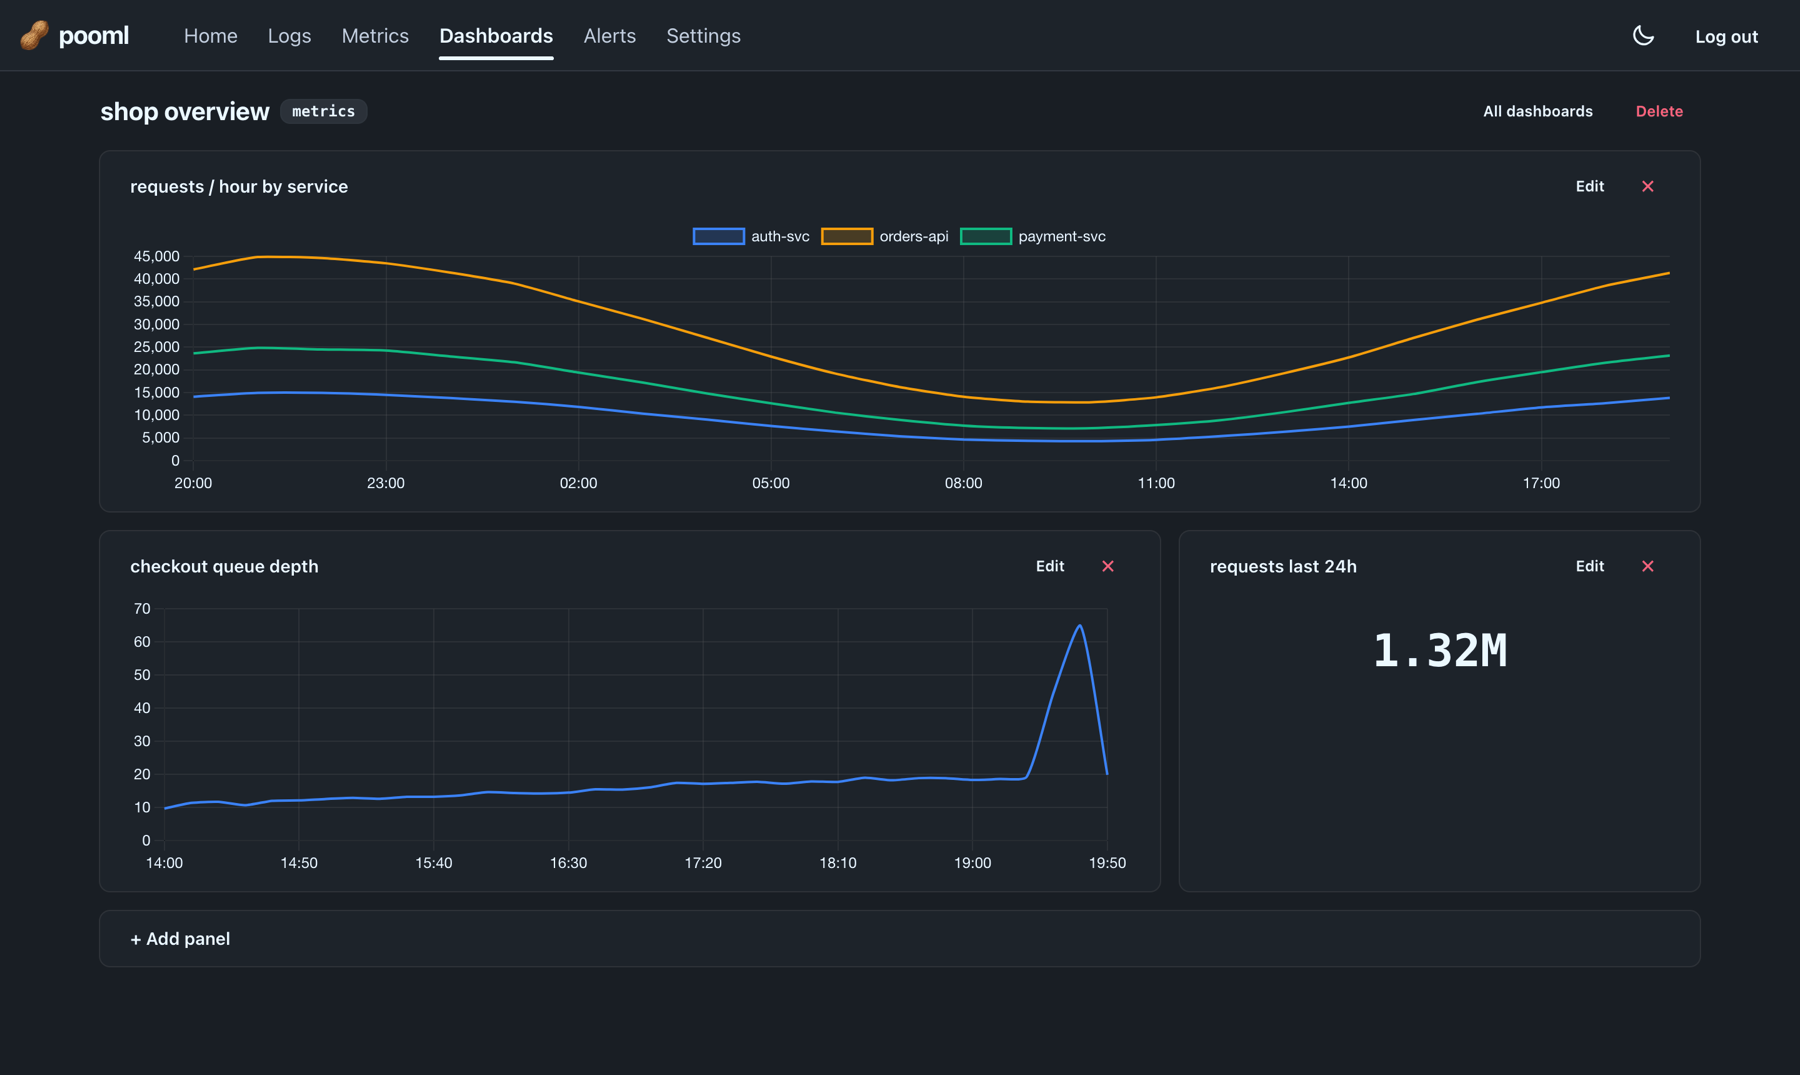
Typed logs/metrics dashboards: stream, chart, and number panels. Panels remember the query that built them.
Alerts
Alert rules are SQL queries too. Delivered via Pushover or Once Campfire, with cooldowns and an audit trail.
Ops included
Hourly retention cleanup, scheduled S3 backups via SQLite's online backup API, Prometheus /metrics - pooml can monitor itself.
Your data, in files
Three SQLite files you can copy, back up, or open with any SQLite tool. No telemetry, no phone-home, ever.
Runs on peanuts
Hence the mascot. One Go binary, three SQLite files, no JVM, no cluster, no sidecar agents. It's perfectly happy on the cheapest VPS your cloud sells - the one that costs about as much as a bag of peanuts.
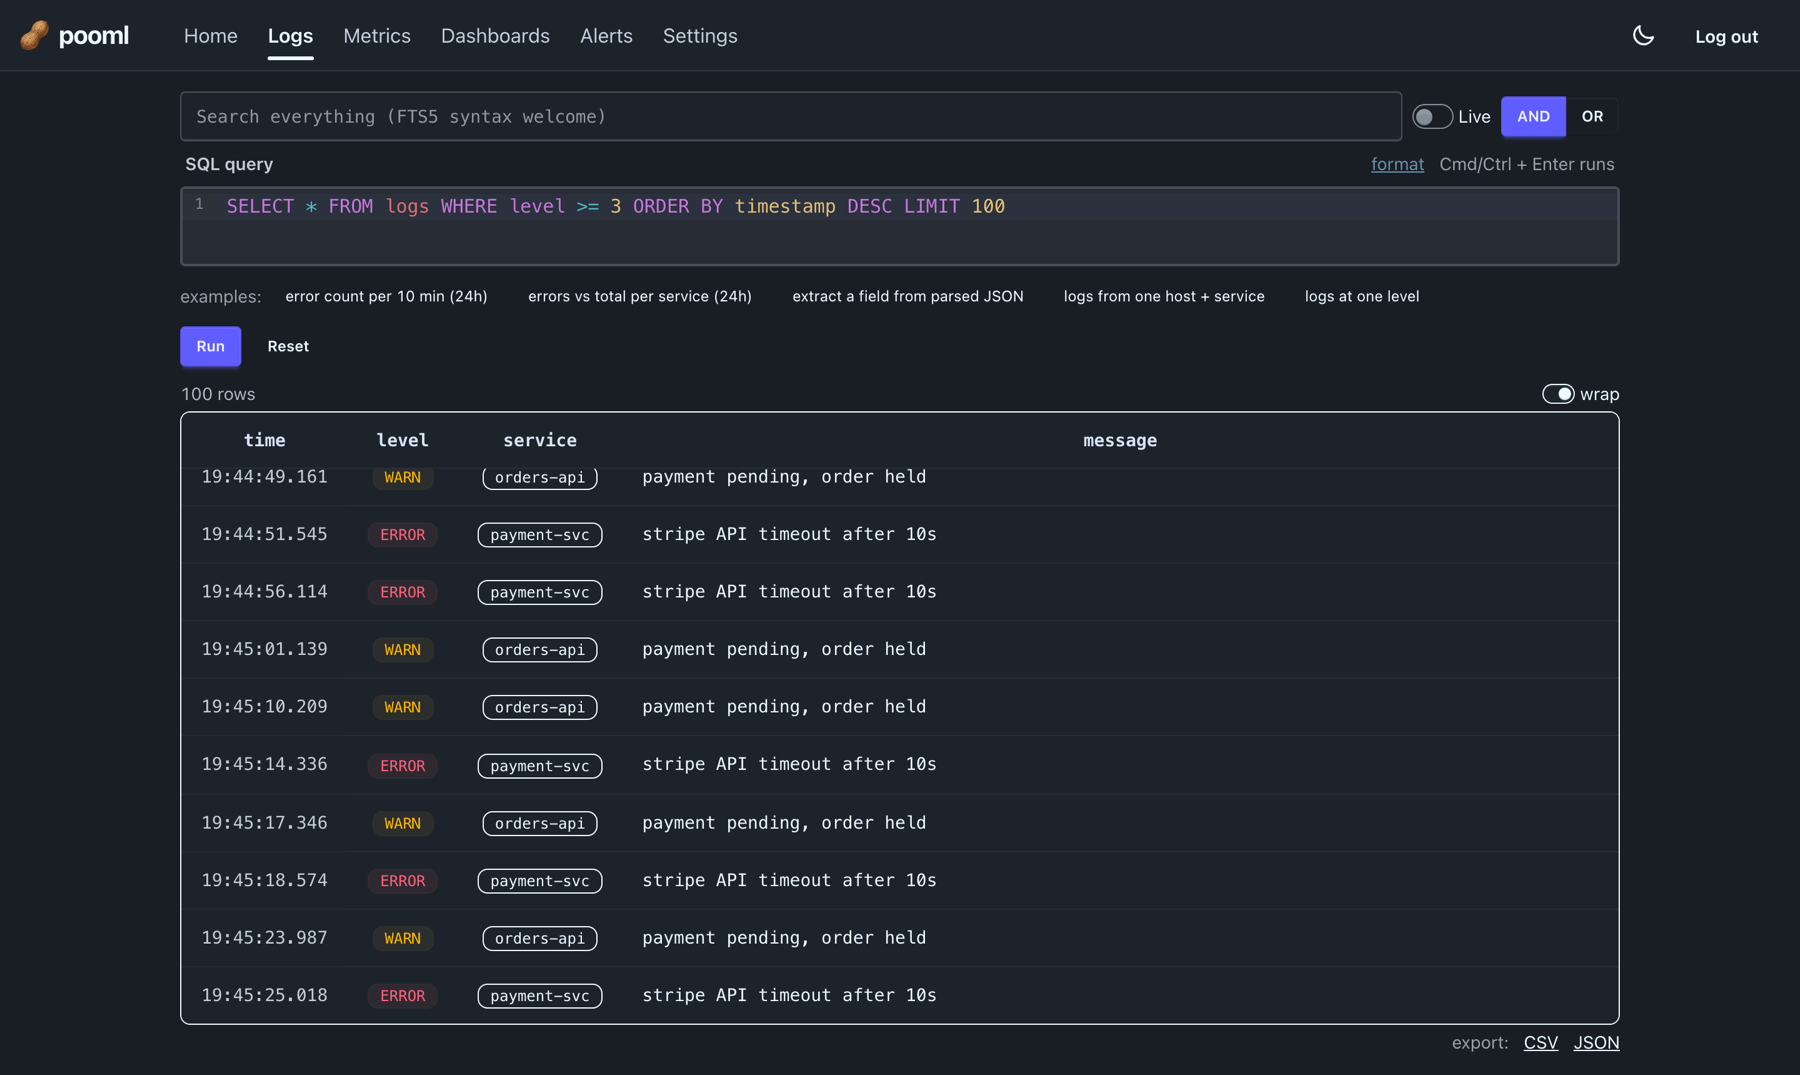
WHERE level >= 3 and there's your story.pooml is not for everyone
- It is not distributed and not highly available. One node, one binary, one disk.
- It is single-admin: one login secret, no user management, no RBAC.
- It is closed-contribution: open source, but no PRs - bugs and ideas go to GitHub Discussions.
- It is small and close to feature-complete: expect bug fixes and dependency updates, not a growing feature list.
- If you have a platform team and a compliance department, you want Grafana & friends. Godspeed - they're great.
If you have three side projects on a VPS and grep-over-ssh has stopped being funny: welcome.
Quick start
Run it:
docker run -d --name pooml --restart unless-stopped \ -e POOML_UI_SECRET=change-me-to-something-long-and-random \ -e POOML_ENCRYPTION_KEY=change-me-too-32-chars-minimum-ok \ -e POOML_DB_DIR=/data \ -p 8080:8080 -p 127.0.0.1:8081:8081 \ -v pooml-data:/data \ mykonordy/pooml:latestOpen
http://localhost:8081, log in with your secret, mint an API key in Settings. On a remote server, tunnel in first:ssh -L 8081:localhost:8081 you@your-server.Point your log shipper at port 8080:
curl -X POST "http://localhost:8080/api/v1/ingest/my-service/my-host" \
  -H "X-API-Key: $API_KEY" \
  -d '{"level":"info","message":"hello pooml"}'
Binaries for Linux amd64/arm64 are on the releases page; building from source needs Go and the sqlite_fts5 tag. The README covers FluentBit, OTLP, scrape targets, retention, and S3 backups.
Configuration
Everything is environment variables. The required ones fail fast at startup with a clear message; the rest have defaults you can ignore.
| Variable | Default | Purpose |
|---|---|---|
POOML_DB_DIR | required | Directory for the three SQLite files. Created if missing. |
POOML_UI_SECRET | required | UI login secret, min 32 chars. |
POOML_ENCRYPTION_KEY | required | Encrypts secrets stored in meta.db (S3 creds, tokens), min 32 chars. |
POOML_ENV | pro | local / pro. Cookie Secure flag, HSTS, log verbosity. |
POOML_API_ADDR | localhost:8080 | Ingestion API bind address. |
POOML_UI_ADDR | localhost:8081 | Web UI bind address. |
POOML_LOG_LEVEL | info | pooml's own log level. |
POOML_TRUST_PROXY_HEADERS | false | Read client IPs from X-Forwarded-For. Only behind a proxy that overwrites it. |
POOML_METRICS_ENABLED | false | Expose pooml's own Prometheus metrics + self-scrape. |
POOML_METRICS_AUTH_SECRET | - | Required when metrics are enabled, min 32 chars. |
POOML_QUERY_API_ENABLED | false | Read-only SQL query API at /api/v1/query/*. |
POOML_QUERY_API_AUTH_SECRET | - | Required when the query API is enabled, min 32 chars. |
POOML_SHUTDOWN_TIMEOUT_SECONDS | 30 | Hard deadline for graceful shutdown. |
Trusted in production
Real products keeping their logs in pooml.
